Scientific Investigation
IB Chemistry IA / Scientific Investigation: From Question to Evaluation
A practical and ethical current-syllabus guide to the research question, pilot, data analysis, uncertainty, conclusion and evaluation.
Read in Vietnamese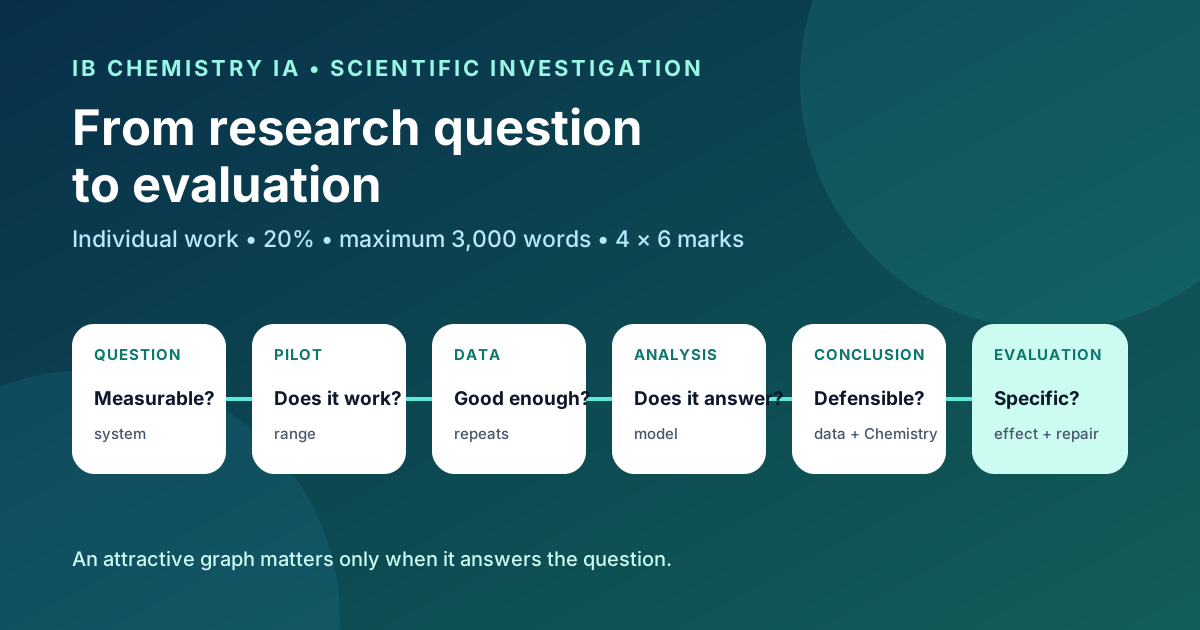
The work commonly searched for as the IB Chemistry IA is officially called the Scientific Investigation in the current course. It is not the story of a perfect experiment. It is a data-justified chemical answer to an individual research question. Much of the report’s quality is determined before writing begins: the question, measurement range, instrument resolution, repeats and pilot limit what can later be concluded.
This guide supports planning and self-review; it does not produce assessed work for a student. Research decisions, data analysis and every submitted sentence must remain the student’s own.
The current task at a glance
| Official feature | Requirement |
|---|---|
| Who completes it? | both SL and HL students |
| Nature of the work | one individual Scientific Investigation |
| Weight | 20% of the final Chemistry grade |
| Recommended time | 10 hours |
| Report | maximum 3,000 words |
| Total marks | 24 |
| Criteria | Research design, Data analysis, Conclusion, Evaluation |
| Each criterion | maximum 6 marks; 25% of the IA each |
| Assessment | internally assessed by the teacher, externally moderated by the IB |
| Authenticity | the submitted work must be the student’s own |
The 3,000 words are a maximum, not a target. The IB Chemistry guide excludes items including data tables, equations, calculations, citations and bibliography from the word count, but this does not justify overcrowded figures or hiding prose in tables. Follow the school’s submission instructions too.
The four criteria are marked separately, but they are not four isolated essays. One evidence chain connects them: the question determines the method, the method determines data quality, the data determine analysis, and the analysis limits the conclusion and evaluation.
Build one evidence chain
The investigation is one evidence chain
- QuestionMeasurable and chemically meaningful
- MethodControls the relevant variables
- RangeResolves the expected change
- Data qualityEnough precision and repetition
- AnalysisAnswers the question
- ConclusionClaim justified by evidence
- EvaluationSpecific limits and improvements
Each link carries a different risk:
- Question: too broad, purely descriptive or not measurable.
- Method: the dependent variable is not measured directly or reproducibly enough.
- Range and resolution: the expected change is smaller than uncertainty, or the reaction is too fast.
- Data quality: too few repeats, inconsistent controls or missing raw readings.
- Analysis: an attractive graph appears, but its quantity does not answer the research question.
- Conclusion: the claim is stronger than the evidence.
- Evaluation: generic “human error” appears without a specific effect or improvement.
Editing prose late cannot recover data that were never measured. The most valuable checks therefore occur before full data collection and immediately after it.
Filter the research question
A viable question is not “HL quality” because it uses an exotic chemical or university instrument. It is strong when it is chemically meaningful, measurable and deep enough for all four criteria.
Use eight filters:
- Chemical meaning: does the answer require a chemical principle?
- Defined system: which substances, reaction, medium and conditions are involved?
- Independent variable: are range and interval numerical?
- Dependent variable: can it be measured directly or derived defensibly?
- Measurement fitness: do instrument resolution and precision match the expected signal?
- Controls: can the important confounding variables genuinely be controlled?
- Data and analysis: will there be sufficient quantitative data, repeats and a visible analysis route?
- Feasibility: is the work safe, ethical, environmentally proportionate and realistic in time?
Weak: “How does temperature affect reaction rate?”
Stronger starting point: “How does temperature from 20.0 to 50.0 °C affect the reciprocal of the time required to reach a defined optical endpoint in a specified sodium thiosulfate–hydrochloric acid system, while initial concentrations and total volume remain constant?”
The second question exposes the system, range, measured quantity and major controls. It still requires a pilot. For detailed filters and the one-page decision sheet, use the IA research-question and pilot guide.
Use the pilot to change a decision
A pilot is not a miniature confirmation of the hypothesis. It tests whether the method can produce evidence of the quality required by the question.
A trial of a 20–50 °C rate investigation might show:
- the difference between 20 and 25 °C is barely larger than the spread of repeats;
- at 50 °C the reaction is so fast that manual starting and reading introduce substantial delay;
- between 30 and 45 °C a measurable, reproducible change appears.
A pilot should change a decision
The 20–25 °C difference is barely larger than the scatter.
Increase resolution or change the interval.
At 50 °C the endpoint occurs before reliable readings can be taken.
Shorten the interval or change the measurement method.
The central temperatures give a measurable response without saturating the method.
Concentrate repeats where the method is informative.
The response may be a narrower range, smaller or unequal intervals, a different measurement method, more repeats, better temperature control or a revised question. The wrong response is to discard inconvenient pilot results and begin full collection with the method unchanged.
A useful pilot note connects every observation to a decision:
| Pilot observation | What does it threaten? | Method decision | How will it be checked? |
|---|---|---|---|
| signal smaller than spread | distinction between levels | wider range or better resolution | repeat two extreme points |
| reaction too fast | timing accuracy | automated sensor or lower temperature | repeated start points |
| solution cools during measurement | control of independent variable | thermostated medium and measured actual temperature | before-and-after readings |
Move from raw data to a chemical claim
Data analysis is not a competition to perform more calculations. It is an auditable route from measurement to the answer.
1. Raw data: every direct reading, unit, instrument and relevant qualitative observation. Do not record only averages.
2. Instrument and resolution: state the display increment and how measurement uncertainty is treated. Many decimal places on a digital display do not guarantee accuracy.
3. Repeats: repetition reveals spread and helps identify an anomalous result. Exclude a value only for a documented scientific reason.
4. Processed quantity: mean, rate, concentration, energy, equilibrium constant or another value belongs only when it advances the research question.
5. Graph or model: axes, units, uncertainty and fit should be clear. Do not force a linear model merely because a trendline is convenient.
6. Chemical claim: state what the trend shows, which values support it, which chemical model interprets it and where the evidence stops.
An auditing reader should be able to trace one graph point back to its original readings and understand why it is relevant to the research question.
Treat uncertainty as information
Uncertainty is not a compulsory “errors” paragraph. It shows how strong a comparison is and how precise a conclusion can be.
With random spread, repeated readings differ. Timing, reading noise or inconsistent sample handling may contribute. Repetition and averaging can reduce the influence of random variation, but cannot repair insufficient instrument resolution.
A systematic bias can shift results in a similar direction: an incorrectly calibrated pH meter, continuing heat loss or a stock solution of incorrect concentration. More repeats do not move the result closer to the true value; calibration, control measurement or method change is needed.
Suppose two mean rates are 1.20 and 1.28 mmol s-1 while spread is about 0.10–0.12 mmol s-1. The difference is small relative to variation, so a strong claim that the conditions differ is not defensible. A difference between 1.28 and 1.86 with the same spread is stronger evidence.
A useful sentence frame is: “The difference of X is [small/large] relative to uncertainty Y; the evidence therefore [weakly/strongly] supports the claim that…”
Write a defensible conclusion
A strong conclusion has four parts:
- Claim: a direct answer, limited to the investigated range.
- Data: a specific trend, value, gradient, model parameter or uncertainty.
- Chemistry: the relevant theoretical relationship and comparison with accepted scientific context.
- Limit: what the data do not show and the conditions attached to the claim.
Weak: “Reaction rate increased with temperature, which agrees with theory.”
More defensible: “Across the investigated 25–45 °C range, the initial rate estimated from reciprocal time increased consistently; the difference between the 25 and 45 °C means exceeded the spread of repeats. This is consistent with a larger fraction of particles possessing energy at least equal to the activation energy at higher temperature. The conclusion is nevertheless limited to reciprocal time measured using this approximate optical endpoint.”
Do not claim causation from a correlational method. Do not generalise beyond the measured range. Uncertainty does not automatically weaken the conclusion; it defines how large a claim is justified.
Evaluate cause, effect, improvement and trade-off
Evaluation: four linked parts
What specifically created the limitation?
Which measurements or derived values changed?
Was the result raised, lowered or made less precise?
What would reduce the effect, and what would it cost?
“Human error” is not an evaluation because it identifies no mechanism. “Use more precise equipment” is also insufficient unless the affected data and expected improvement are clear.
Specific example: manually starting a stopwatch 0.4–0.8 s after reagent addition can disproportionately increase measured time in short, high-temperature trials. It may therefore lower rate calculated from reciprocal time and flatten the apparent temperature trend. An automatically triggered light sensor would reduce delay that varies relative to reaction time; in exchange it requires calibration, data-logging equipment and more setup time.
For every important limitation ask:
- which data were affected;
- in which direction and with what likely magnitude;
- whether it changed validity or mainly precision;
- whether the proposed improvement actually treats that cause;
- what new limitation or resource demand the improvement creates.
Two or three detailed, evidence-based evaluations are more useful than a list of ten generic errors.
Protect authenticity and academic integrity
The IB guide is explicit: the submitted Scientific Investigation must be the student’s own work. Support is allowed, but decisions and writing cannot be outsourced.
Potentially appropriate, subject to school rules:
- teacher explanation of criteria and scientific concepts;
- questions that help the student notice a gap in the method;
- feedback on a draft within IB and school limits;
- technical support for safe equipment use;
- teaching source-search and referencing methods;
- a language or structure checklist that does not rewrite the student’s argument.
Not appropriate or a serious risk:
- inventing a research decision, data or result;
- analysing the student’s data for them;
- submitting paragraphs written by someone else;
- taking material without citation;
- submitting AI-generated prose as the student’s own;
- rewriting the report until it no longer reflects the student’s thinking.
For AI use, check the school’s current rule first. If any use is allowed, document the tool, purpose, assistance received and any required citation or declaration. AI cannot replace source verification or turn unmeasured data into real evidence.
What can parents do?
A parent can support the process without writing Chemistry or prose:
- make milestones and school deadlines visible;
- ask whether the pilot happened before full data collection;
- check that safe, authorised equipment access exists;
- remind the student to preserve raw data, versions and sources;
- ask about decisions: “Which pilot result made you change the method?”
Do not rewrite the conclusion, recalculate and select the “better-looking” data, or search for a finished IA to copy. Student ownership and thinking are part of the assessment.
A ten-week workflow with two decision gates
A four-phase, ten-week workflow
Background, variables, feasibility and safety.
Test the method; approve or redesign before full collection.
Collect, process and audit sufficient data.
Conclude, evaluate, reference and complete the integrity check.
Phase 1 — question and feasibility, weeks 1–2
Background theory, variables, safety, equipment and an initial method outline. The output is a pilotable question, not a polished introduction.
Phase 2 — pilot gate, weeks 3–4
Test extreme and middle points, timing, resolution and controls. Week 4 gate: approve, modify or redesign the method. Full collection begins only after a documented decision.
Phase 3 — data and evidence gate, weeks 5–7
Collect repeats, preserve raw data, process a sample calculation and test whether the graph is meaningful. Week 7 gate: are quantity, quality and traceability sufficient to answer the question? If not, collect what is missing now—not in week 10.
Phase 4 — argument and integrity, weeks 8–10
Conclusion with data and accepted context, detailed evaluation, final references, word limit, figure audit, authenticity check and AI declaration under school rules.
Every week should end with a tangible output: decision sheet, pilot note, raw-data backup, analysis audit or revised section. “Worked on it” is not a milestone.
Final submission check
Question and design
- The question is precise, contextualised, measurable and chemically relevant.
- Independent and dependent variables, range, intervals, repeats and controls are justified.
- The method is reproducible without unnecessary recipe prose.
- Safety, ethical and environmental decisions are specific.
Data and analysis
- Every graph point traces back to raw readings.
- Units, significant figures, instrument resolution and uncertainty are consistent.
- Calculations and graphs answer the research question; no analysis is decorative.
- Any excluded value has a documented scientific reason.
Conclusion and evaluation
- The conclusion directly answers the question using specific data and uncertainty.
- Comparison with accepted chemical context is referenced.
- Each important limitation links cause, affected data, direction, improvement and trade-off.
- The claim does not exceed the measured range or evidential strength of the method.
Submission and integrity
- The report is no more than 3,000 words and states the word count.
- Every source is cited appropriately and the bibliography is complete.
- Any AI declaration required by the school is complete.
- Versions, raw data and calculations are traceable.
- Every figure is readable, labelled and contributes directly to answering the research question.
- Every scientific decision and submitted sentence is the student’s own.
A strong Scientific Investigation does not pretend the experiment was flawless. It shows that the student recognised the limits of the evidence, interpreted the data using appropriate Chemistry and made exactly the claim that the investigation can defend.
ChemistryTutor.vn
Build stronger evidence without outsourcing assessed work
Structured support can improve the question, pilot, analysis and evaluation while every research decision and submitted word remain the student's own.
Explore Scientific Investigation support